CHEM2131 Laboratory Experiments Summary
Comprehensive Step-by-Step Guide with Visual References
Complete Procedures for All 11 Experiments
Author: Iraj Mehrnia, Durham College - 2025
×
Use controls above to zoom and pan | Click outside or press ESC to close | Scroll to zoom
EXPERIMENT 1: Emission Spectra of Various Elements
Equipment: Prism spectrometer, element lamps (He, H₂, Ne/Ar)
Steps:
- Set up prism spectrometer and clamp to bench
- Place lamp in front of collimator, open slit fully
- Align 360° scale with zero at collimator center, lock prism table
- Position prism with pointed edge toward collimator (clear side away)
- Set telescope 90-180°, look for emission spectrum lines
- Lock telescope, adjust prism table until lines are sharp and vertical
- Close slit until spectrum is narrow but visible
- For each spectral line: align crosshairs, read Vernier scale angle
- Record angles for all visible lines for each element
- Use helium calibration data to determine hydrogen wavelengths
- Calculate % error vs. literature values
- Calculate Rydberg constant from data
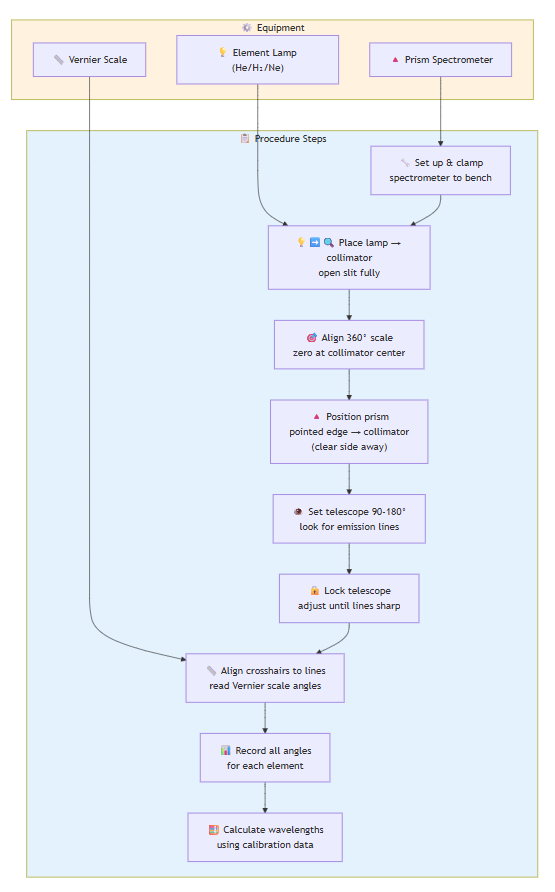
EXPERIMENT 1: Emission Spectra of Various Elements
Click image for high-resolution interactive diagram
EXPERIMENT 2: Water Purification and Analysis
Part I - Water Purification:
- Fill experimental beaker ¾ with water, add 10.0g soil, stir
- Pour half muddy water into control beaker, set aside
- Add lime solution dropwise until red litmus turns blue
- Add alum solution until thick white precipitate forms
- Stir thoroughly and let settle for several minutes
- Compare treated vs. control beaker
Part II - Water Analysis:
- Prepare hydrogen exchange filtered water using resin column
- Test conductivity of all water samples with LED device
- Add BaCl₂ and AgNO₃ to samples, observe precipitates
- Perform flame tests (clean wire with HCl between tests)
- Determine water hardness by EDTA titration (count drops to endpoint)
- Calculate hardness in ppm using: hardness (ppm) ≈ (5)(# of drops)
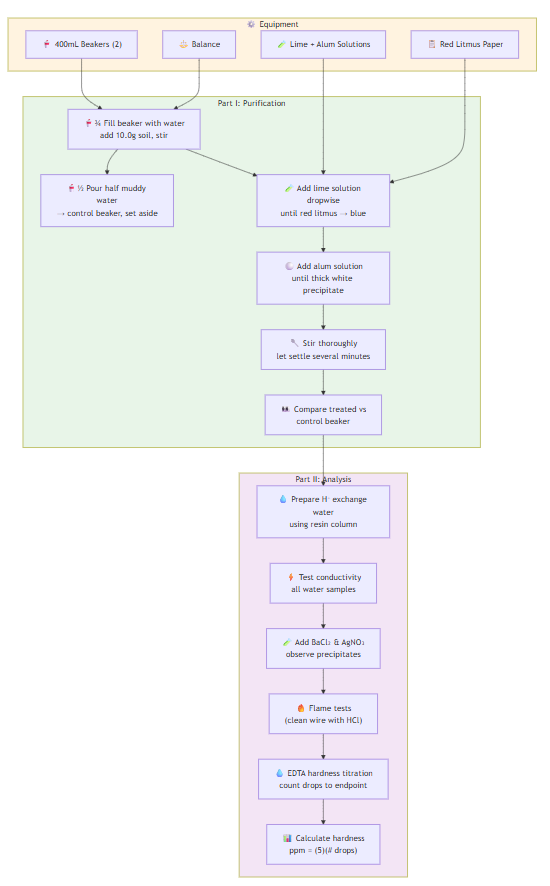
EXPERIMENT 2: Water Purification and Analysis
Click image for high-resolution interactive diagram
EXPERIMENT 3: Determination of Phosphate in Cola
Preparation:
- Weigh 0.1360g dry KH₂PO₄, dissolve in 500mL water with 0.5mL H₂SO₄
- Prepare standards: 2.0×10⁻⁵, 5.0×10⁻⁵, 1.0×10⁻⁴, 5.0×10⁻⁴, 7.5×10⁻⁴ M
- Boil 100mL cola for 10 minutes to remove CO₂
Analysis:
- Mix 10mL each standard + 5mL vanadomolybdate reagent
- Add 0.5mL H₂SO₄ to cola, dilute 50-fold
- Mix 10mL diluted cola + 5mL vanadomolybdate reagent
- Wait 20 minutes for color development
- Measure absorbance at 400nm (blank = zero)
- Plot calibration curve, determine cola phosphate concentration
- Account for dilution factor in final calculation
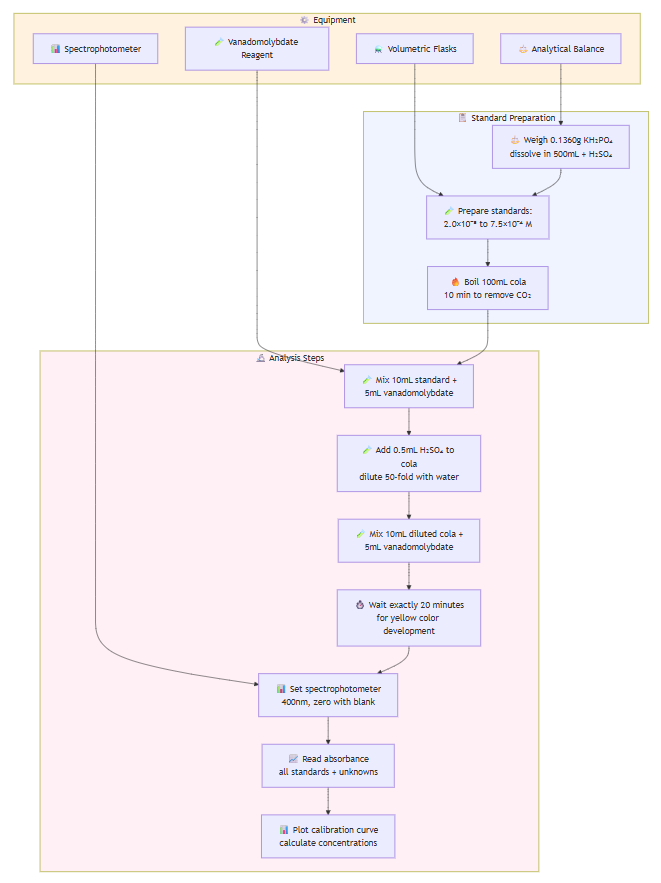
EXPERIMENT 3: Determination of Phosphate in Cola
Click image for high-resolution interactive diagram
EXPERIMENT 4: EDTA Preparation and Standardization
Part I - EDTA Preparation:
- Weigh 1.8-1.9g dried EDTA, record exact weight
- Add 1 NaOH pellet + 400mL DI water in 500mL beaker
- Dissolve with stirring (gentle heat ≤40°C if needed)
- Cool, transfer quantitatively to 500mL volumetric flask
- Dilute to mark with deionized water
Part II - EDTA Standardization:
- Pipet 25mL of 0.01M Mg²⁺ standard into 3 Erlenmeyer flasks
- Add 1mL pH 10 buffer + 2-4 drops Eriochrome Black T to each
- Titrate with prepared EDTA solution to color change (red → blue)
- Run blank titration (25mL DI water + buffer + indicator)
- Calculate EDTA molarity using: M = (Vol Mg²⁺ × M Mg²⁺)/(Vol EDTA)
Part III - Calcium in Water:
- Dilute unknown water sample 5-fold
- Pipet 25mL diluted sample into Erlenmeyer flask
- Add 2mL NH₃/NH₄Cl buffer + 1mL Mg/EDTA + indicator
- Titrate with standardized EDTA to blue endpoint
- Calculate Ca²⁺ concentration, convert to ppm
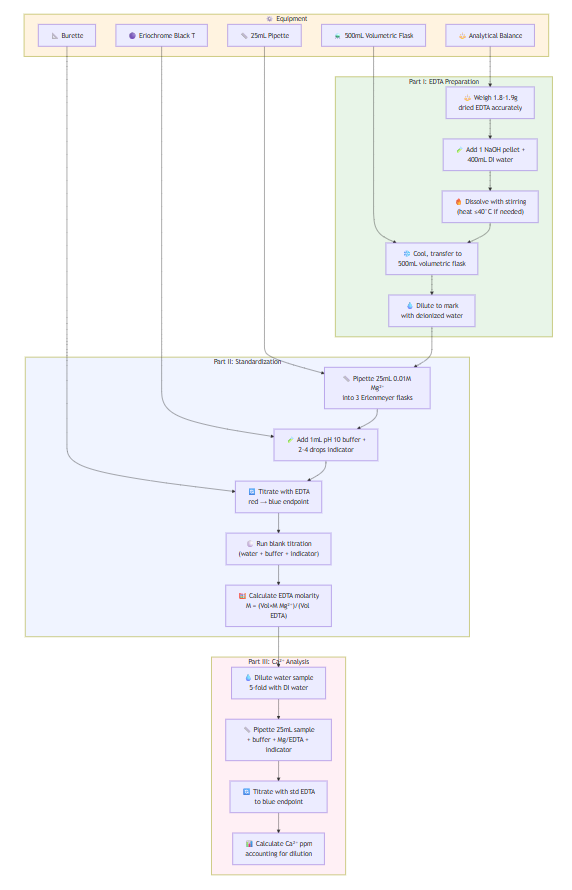
EXPERIMENT 4: EDTA Preparation and Standardization
Click image for high-resolution interactive diagram
EXPERIMENT 5: Soaps and Detergents
Part I - Soap Preparation:
- Fill large beaker with water, add boiling chips, heat
- Add 30mL 15% NaOH alcohol solution to small beaker
- Place 5.0g lard/oil in 125mL flask + NaOH solution
- Add boiling chips, cover with watch glass
- Heat in boiling water bath for 40 minutes
- Prepare salt solution: 25g NaCl in 150mL water
- Pour hot reaction mixture into salt solution, stir
- Filter through cheesecloth, wash twice with ice water
- Describe soap appearance, color, texture, odor
Part II - Detergent Preparation:
- Place 5.0mL dodecanol in 100mL beaker
- FUME HOOD: Slowly add 2.0mL concentrated H₂SO₄ while stirring
- Stir 1 minute, let stand 10 minutes
- Prepare ice-salt bath in 250mL beaker
- Add phenolphthalein to 15mL dilute Na₂CO₃
- Slowly add Na₂CO₃ to dodecanol-H₂SO₄ mixture until pink disappears
- Pour into ice-salt bath, filter and wash product
Part III - Testing Properties:
A) Emulsification: Test oil + water vs. oil + soap vs. oil + detergent
B) Hard Water: Test samples with CaCl₂, MgCl₂, FeCl₃ solutions
C) pH: Test with indicator paper
D) Acid Reaction: Add HCl to pH 4.5, observe precipitates
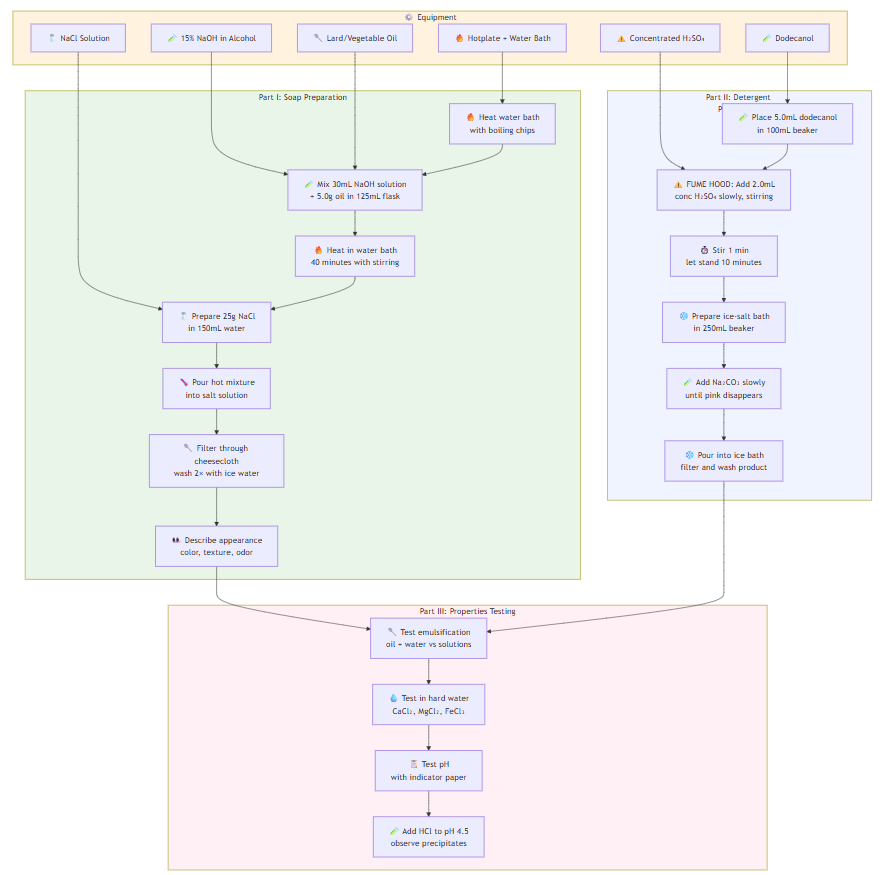
EXPERIMENT 5: Soaps and Detergents
Click image for high-resolution interactive diagram
EXPERIMENT 6: Ascorbic Acid in Vitamin C Tablets
Sample Preparation:
- Weigh 10 vitamin C tablets, calculate average weight
- Grind 3-5 tablets, weigh four ~400mg samples accurately
- Dissolve each sample in 100mL oxygen-free water + 25mL 2N H₂SO₄
Titration:
- Perform rapid titration first to find approximate endpoint
- Titrate samples with 0.10N iodine solution
- Add 3mL starch solution as endpoint approaches
- Endpoint: dirty purple color persisting >90 seconds
- Perform blank titration
- Record all volumes accurately
Calculations:
- Each mL 0.1N iodine = 8.806mg C₆H₈O₆
- Calculate mg ascorbic acid per tablet
- Compare to label claim (should be 90.0-110.0% of stated amount)
- Determine if results meet USP guidelines
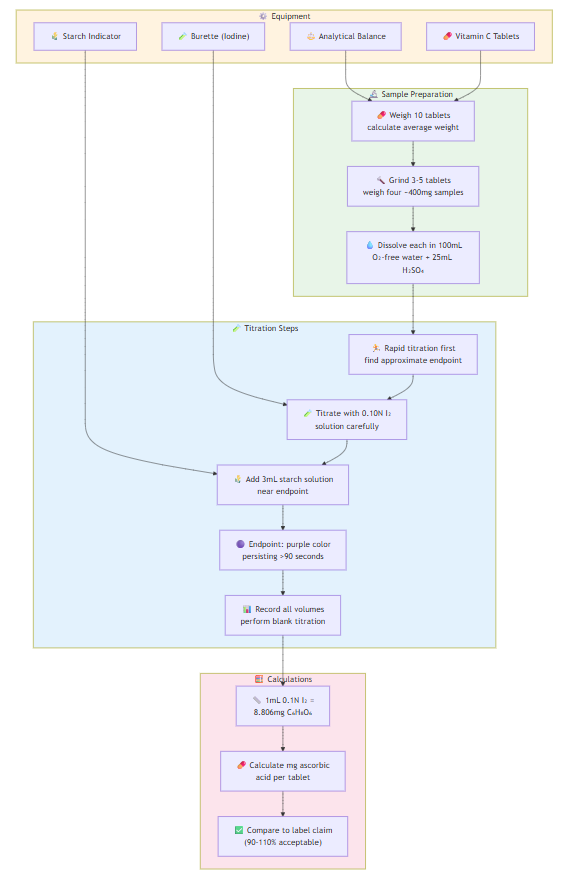
EXPERIMENT 6: Ascorbic Acid in Vitamin C Tablets
Click image for high-resolution interactive diagram
EXPERIMENT 7: Gravimetric Analysis
Part I - Chloride Analysis (duplicate):
- Weigh 0.2-0.4g unknown chloride salt accurately
- Dissolve in 150mL DI water + 1mL 6M HNO₃ in 250mL beaker
- Add ~20mL 0.5M AgNO₃ solution while stirring
- Heat gently 5-10 minutes (do not boil), keep warm
- Filter on pre-weighed filter paper using vacuum
- Wash precipitate with water, then acetone
- Dry in 80°C oven, weigh AgCl precipitate
- Calculate % chloride using gravimetric factor 0.2473
Part II - Phosphorus in Fertilizer (duplicate):
- Weigh ~1g fertilizer, dissolve in 25-30mL water
- Filter if insoluble residue present
- Add 30mL 10% MgSO₄·7H₂O solution
- Slowly add 100mL 2M NH₃ while stirring
- Let stand 15 minutes for complete precipitation
- Filter on pre-weighed paper, wash with water then 75% isopropanol
- Dry at 80°C, weigh MgNH₄PO₄·6H₂O precipitate
- Calculate % P and % P₂O₅ in fertilizer sample
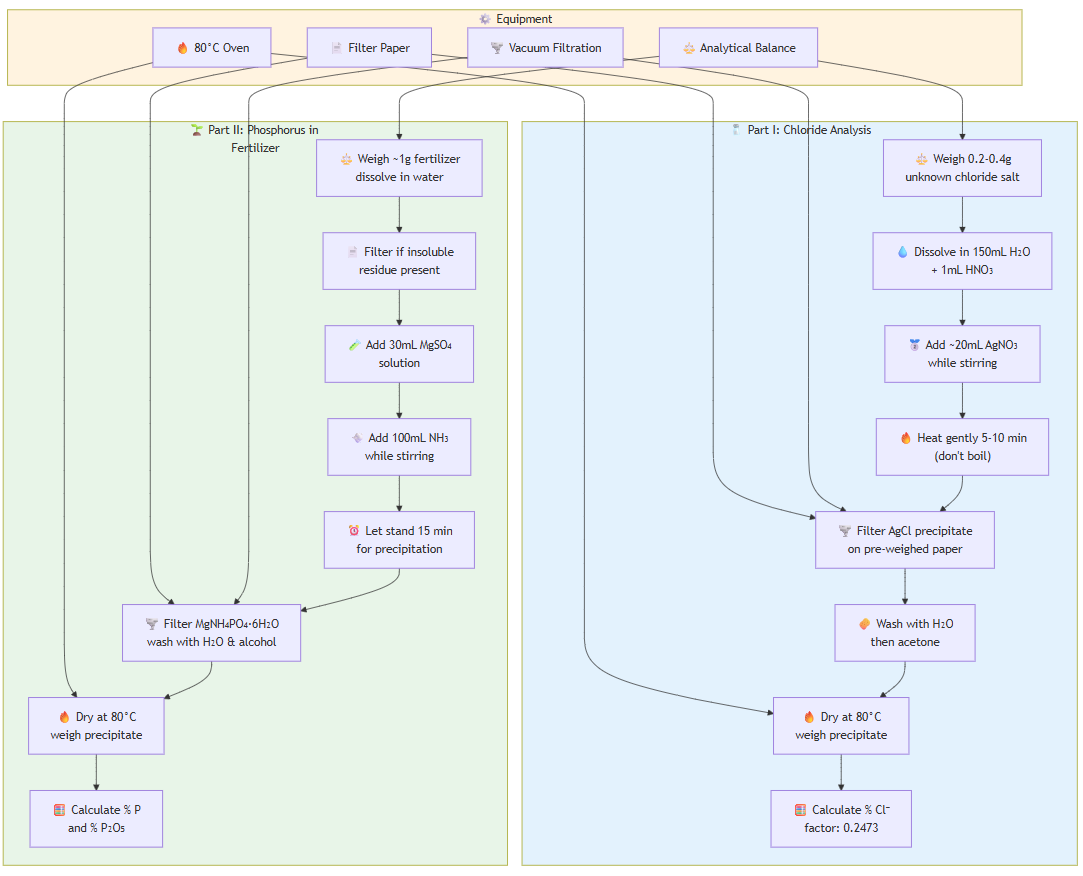
EXPERIMENT 7: Gravimetric Analysis
Click image for high-resolution interactive diagram
EXPERIMENT 8: Nitrite Content in Water and Soil
Standard Preparation:
- Calculate dilutions from 10ppm stock to make 0, 0.5, 1.0, 1.5, 2.0, 2.5 ppm standards
- Use 100mL volumetric flasks for accurate dilutions
- Label all solutions clearly
Analysis:
- Add 4mL Marshall's reagent to each standard
- Add 1mL Marshall's reagent to unknown water samples
- Mix well, wait exactly 20 minutes for color development
- Set spectrophotometer to 510nm
- Zero with blank solution
- Read absorbance of all standards and unknowns
- Ensure all readings <2.0 (dilute if necessary)
- Plot calibration curve: absorbance vs. concentration
- Use equation of line to calculate unknown concentrations
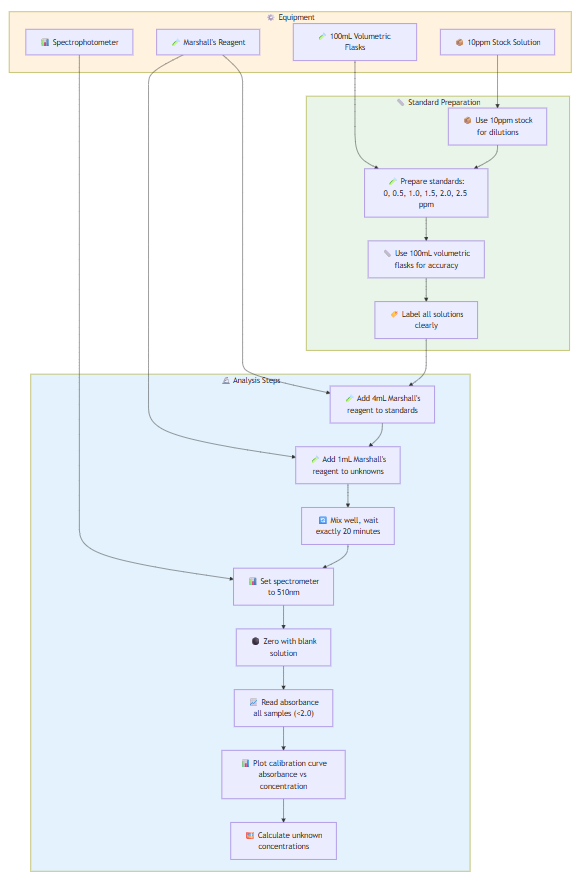
EXPERIMENT 8: Nitrite Content in Water and Soil
Click image for high-resolution interactive diagram
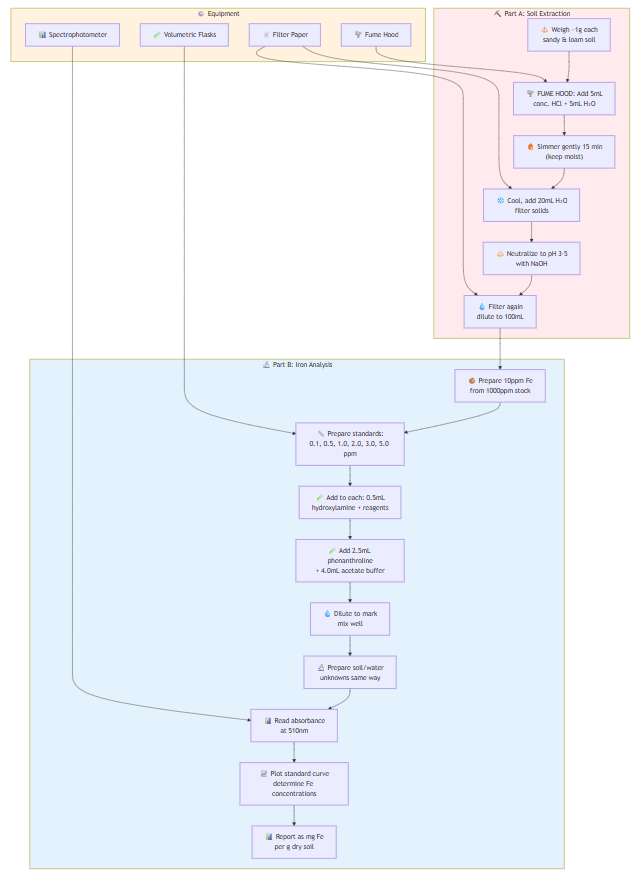
EXPERIMENT 9: Iron Determination
Part A - Soil Extraction:
- Weigh ~1g each of sandy and loam soil into 250mL beakers
- FUME HOOD: Add 5mL concentrated HCl + 5mL water
- Simmer gently 15 minutes (keep moist, add water if needed)
- Cool, add 20mL water, filter to remove solids
- Neutralize filtrate to pH 3-5 with NaOH
- Filter again if necessary, dilute to 100mL
Part B - Iron Analysis:
- Prepare 10ppm Fe stock from 1000ppm standard
- Prepare standards: 0.10, 0.50, 1.0, 2.0, 3.0, 5.0 ppm in volumetric flasks
- Add to each flask: 0.5mL hydroxylamine HCl + 2.5mL phenanthroline + 4.0mL acetate buffer
- Dilute to mark, mix well
- Prepare soil and water unknowns the same way
- Read absorbance at 510nm after color development
- Plot standard curve, determine Fe concentrations
- Report soil results as mg Fe per g dry soil
EXPERIMENT 9: Iron Determination
Click image for high-resolution interactive diagram
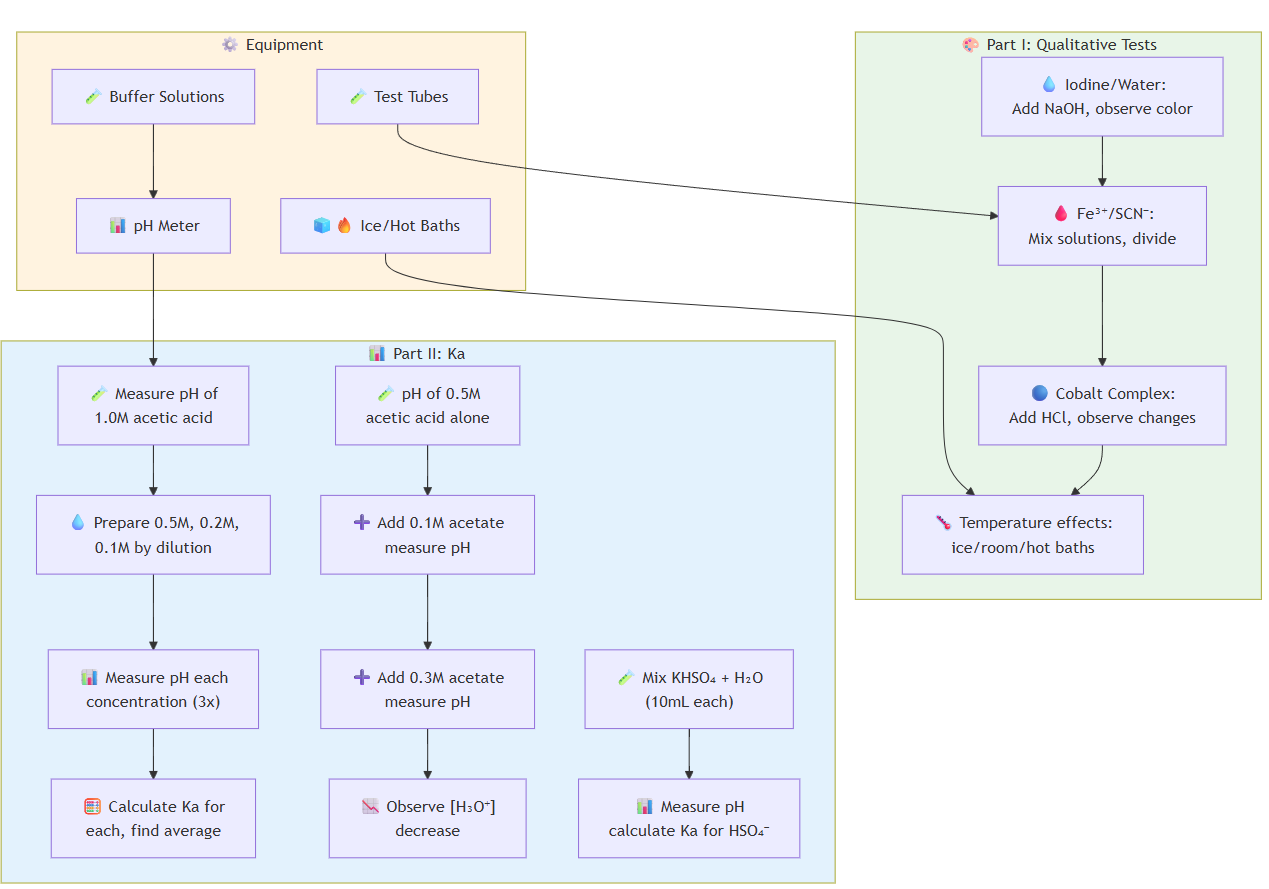
EXPERIMENT 10: Equilibrium
Part I - Qualitative Equilibrium:
A) Iodine/Water System:
- Add NaOH drops to I₂ solution, observe color change
- Test prediction by adding acid to reverse reaction
B) Fe³⁺/SCN⁻ System:
- Mix 10mL each of 0.01M FeCl₃ and KSCN solutions
- Divide mixture, add concentrated FeCl₃ to one half, KSCN to other
- Observe color intensity changes
C) Cobalt Complex System:
- Add 2mL concentrated HCl to 5mL 0.4M Co²⁺ solution twice
- Add water incrementally, observe color changes
- Test temperature effects: divide solution into 3 tubes
- Place in ice bath, room temperature, and boiling water
Part II - Quantitative Ka Determination:
A) Acetic Acid Ka:
- Measure pH of 1.0M acetic acid (3 readings)
- Prepare 0.5M, 0.2M, 0.1M solutions by dilution
- Measure pH of each concentration (3 readings each)
- Calculate Ka for each concentration, find average
B) Acetate Ion Effect:
- Measure pH of 0.5M acetic acid alone
- Measure pH with 0.1M acetate added
- Measure pH with 0.3M acetate added
- Observe [H₃O⁺] decrease with added acetate
C) Bisulfate Ka:
- Mix 10mL 0.1M KHSO₄ + 10mL water
- Measure pH, calculate Ka for HSO₄⁻
EXPERIMENT 10: Equilibrium
Click image for high-resolution interactive diagram
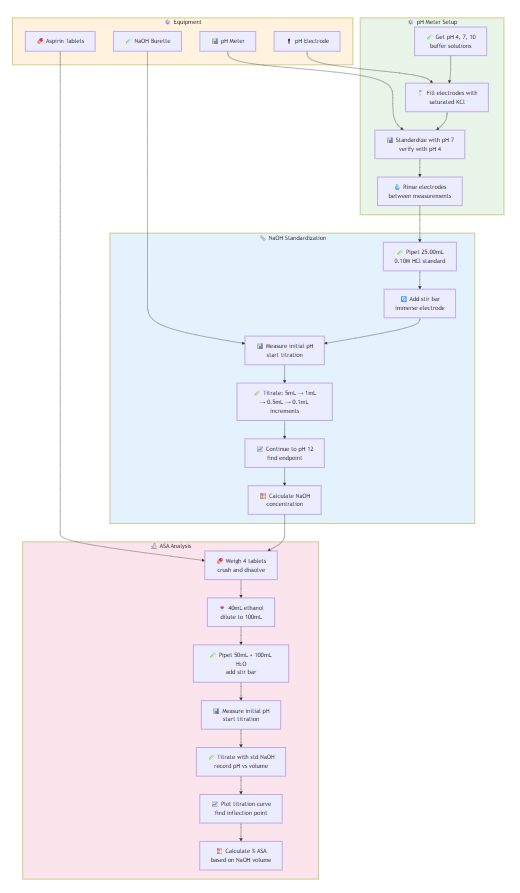
EXPERIMENT 11: Potentiometric Determination of Aspirin
pH Meter Setup:
- Obtain pH 4, 7, 10 buffer solutions
- Fill electrodes with saturated KCl solution
- Standardize with pH 7 buffer, then verify with pH 4
- Rinse electrodes between measurements
NaOH Standardization:
- Pipet 25.00mL standard 0.10M HCl into 250mL beaker
- Add magnetic stir bar, immerse electrode, measure initial pH
- Titrate with NaOH: 5mL increments initially, then 1mL, then 0.5mL near endpoint
- Add 0.1mL increments through sharp pH rise
- Continue to pH 12, determine endpoint, calculate NaOH concentration
ASA Analysis:
- Weigh 4 aspirin tablets, crush and dissolve in 40mL 95% ethanol
- Dilute to 100mL with water in volumetric flask
- Pipet 50mL into 250mL beaker, add 100mL water
- Add stir bar, immerse electrode, measure initial pH
- Titrate with standardized NaOH, record pH vs. volume
- Plot titration curve, find inflection point (equivalence point)
- Calculate % ASA in tablet based on NaOH volume at endpoint
EXPERIMENT 11: Potentiometric Determination of Aspirin
Click image for high-resolution interactive diagram
Each experiment builds specific analytical skills while reinforcing fundamental chemistry concepts through hands-on laboratory experience.